economy
October 10, 2022
Eyes on the Economy: Manufacturing, Personal Income, Trade Balance

U.S. Manufacturing Slows
The Institute for Supply Management’s gauge for economic activity in the manufacturing sector unexpectedly declined to 50.9 in September, the lowest reading since May 2020. Nonetheless, a reading above 50 indicates expansion, suggesting the sector is still expanding, though at a decelerating rate, which could lead to a contraction in the future.
The decline was driven by drops in new orders and employment, which outweighed a slight increase in production. Both new orders (47.1) and employment (48.7) fell below 50, indicating a contraction mode. With months of softening new orders, companies are preparing for lower demand and managing headcounts with hiring freezes. The low employment reading reflects the uncertainty in future demand. Note that the manufacturing sector is sensitive to interest rate movements. As monetary policy moves into restrictive territory, expect the sector to be among the most impacted.
Personal Income and Spending Edge Higher
Personal income increased 0.3 percent from July to August, mostly in line with market expectations. Personal spending, on the other hand, beat the forecast with an increase of 0.4 percent. The spending growth was driven by housing, utilities, transportation and health care—in other words, essential consumption. Meanwhile, spending on goods decreased. This largely reflects consumers shifting from goods to services and essentials as inflation bites into their budget.
In the same release, the Federal Reserve’s preferred inflation gauge, the Personal Consumption Expenditures Price Index (PCE) cooled off to 6.2 percent on a year-over-year basis but still accelerated when compared with a month ago. More importantly, when excluding food and energy, PCE was still rising in both monthly and yearly measures. The alternate inflation gauge, the Consumer Price Index, also indicates that inflationary pressure remains high on consumer spending.
American Goods Trade Balance Improves
The U.S. goods trade deficit narrowed for a fifth consecutive month to $87.3 billion in August, the lowest spread since October 2021. The improvement in the goods trade account reflected a decline in the value of imports (-1.7 percent), which outweighed the decline in exports (-0.9 percent). Overall, the goods trade deficit decreased 3.2 percent. Two forces can be seen driving the movement of the trade balance. First, the impact of rising rates is weighing on demand for goods, including imported items. Demand is driven down when inflation and high rates force consumers to adjust their budgets, shifting from non-essential goods, which tend to be imported, to essentials such as housing and transportation, which are domestic. Second, the appreciation of the U.S. dollar is putting a strain on exports. As the dollar gets more expensive, so do U.S. goods relative to foreign goods. August’s figures, however, seem to suggest that this force was outweighed by the impact of rising rates on imports.
With another month of improvement in the goods trade balance, the forecast for third-quarter growth has been revised up. As trade balance is part of the gross domestic product equation, expect this account to add to the quarter-over-quarter growth.
Goods Trade Deficit Improves, Still Higher Than Pre-COVID
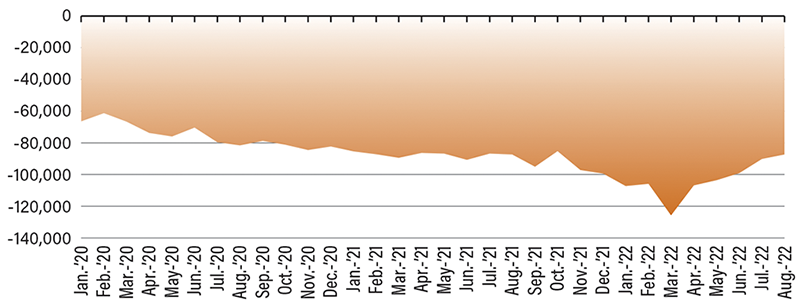
Source: U.S. Census Bureau
Recent Economic Releases
| Indicator | Prior period | Current period (forecast) | Current period (actual) |
|---|---|---|---|
| Institute for Supply Management Manufacturing Index (Sep.) | 52.8 | 52.2 | 50.9 |
| Personal Income (Aug.)(MoM) | 0.3% | 0.3% | 0.3% |
| Personal Spending (Aug.)(MoM) | -0.2% | 0.2% | 0.4% |
| U.S. Goods Trade Balance (Aug.) | $-90.2B | $-85B | $-87.3B |
