economy
November 28, 2022
Eyes on the Economy: Optimism, Deficit, Economic Activity

Economic Optimism Index Dips
The Investor’s Business Daily (IBD)/TechnoMetrica Institute of Policy and Politics (TIPP) Economic Optimism Index declined to 40.4 in November—the lowest reading in three months and below forecasts of 41.5. The index has been below 50, indicating pessimism, for 15 consecutive months.
The sub-index for the six-month outlook for the economy dropped to 34.3 while support for the federal economic policies declined to 38.6. Meanwhile, the share of Americans who think the economy is in a recession slightly decreased from 61 percent in October to 58 percent in November. The share of those concerned about job loss in their household decreased from 38 percent to 32 percent, indicating optimism is still strong in the labor market despite the gloomy outlook in other aspects of the economy.
Monthly Deficit Narrows
The U.S. monthly budget deficit shrank to $88 billion in October from $430 billion in September— a 47 percent decrease from October 2021. The smaller monthly deficit was driven by an increase in individual income taxes collected by the federal government and declines in outlays to the Department of Health, the Department of Veteran Affairs and the Small Business Administration.
Corporate income taxes collected were slightly down and defense spending increased compared to a month ago. With the rise of interest rates, interest payment on Treasury debt securities significantly increased from $19 billion to $47 billion during the same period.
Overall, U.S. debt levels remain high at a time of high inflation and high interest rates. Consequently, the cost of borrowing to fund spending has increased and is expected to continue to rise as the current monetary tightening cycle keeps rates high until at least 2024.
U.S. Economic Activity Weakens
The Chicago Fed National Activity Index (CFNAI) dropped to -0.05 in October, suggesting U.S. economic activity might have slowed at the beginning of the fourth quarter after real gross domestic product rebounded in the third quarter. CFNAI is a monthly index measuring the national economic activity and related inflation pressure. A reading below zero corresponds to growth below historical trends.
All but one of the categories made negative contributions to the index. The production category subtracted from the index as industrial production decreased for two consecutive months. The category for sales, orders and inventories also subtracted from the index after a positive contribution the preceding month.
With the unemployment rate ticking up to 3.7 percent, the employment, unemployment and hours category also moved the index down. The only category that made a positive contribution was personal consumption and housing. Spending in this category rose.
Separately, the Conference Board reported leading indicators declined 0.8 percent—more than forecasts and marking an eighth consecutive decline. According to the Conference Board, that may suggest we are already in a recession.
U.S. Monthly Economic Activity
(April 2021 – October 2022)
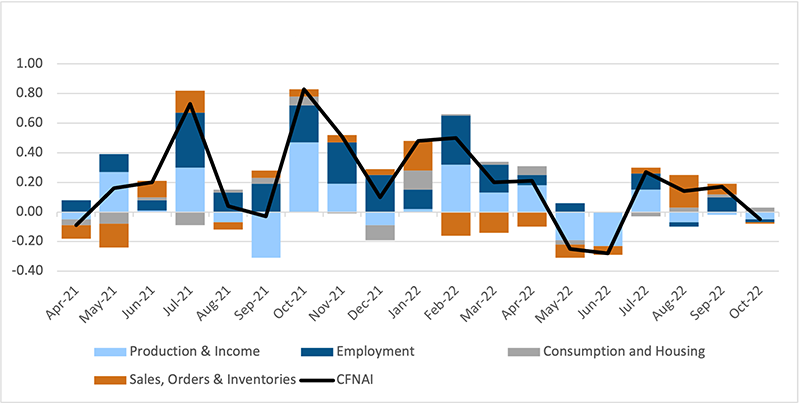
Source: Federal Reserve Bank of Chicago
Recent Economic Releases
| Indicator | Prior period | Current period (forecast) | Current period (actual) |
|---|---|---|---|
| IBD/TIPP Economic Optismism Index (Nov.) | 41.6 | 42.0 | 40.4 |
| U.S. Government Monthly Budget (Oct.) | ($430B) | ($90B) | ($88B) |
| Chicago Fed National Economic Activity Index (Oct.) | 0.17 | 0.1 | (0.05) |
| Conference Board Leading Economic Index (Oct.)(MoM) | (0.5%) | (0.4%) | (0.8%) |
