economy
August 1, 2022
Eyes on the Economy: Production, Economic Index, Housing

Inflation Slows Production
U.S. industrial production increased 4.2 percent in June on a year-over-year basis, the slowest yearly growth rate since January. From a month ago, industrial production declined for the first time this year at a month-over-month rate of 0.2 percent. The decline was driven by a contraction of production in the most important sector, manufacturing, which posted a second consecutive month-over-month decline of 0.5 percent. The sluggish output was attributed to a buildup in inventory and a gloomy economic outlook caused by high inflation risk on sales and consumption of goods.
Meanwhile, annual producer inflation as measured by the Producer Price Index accelerated to 11.3 percent in June—edging closer to the record high of 11.6 percent seen in March. With producer inflation remaining elevated, expect consumer price pressure to stay stubbornly high.
Leading Economic Index Falls
The Conference Board Leading Economic Index (LEI) for the United States declined 0.8 percent in June after a previous decline of 0.6 percent in May. Over the first half of 2022, the Conference Board LEI dropped by 1.8 percent. Consumer pessimism, falling equity prices, weaker manufacturing and fears of declines in the labor market drove the index’s decline. As the name implies, the LEI comprises key leading economic indicators—defined as indicators that move before a turning point of the economy. The composite has a predictive power of what is coming within the next seven months.
The Coincident Economic Index (CEI)—comprising indicators that move coincidently with a turning point—increased 1.2 percent in the first half of 2022, suggesting the economy was still growing. Together, both indices suggest that while the economy is still in a growth mode, a downturn is coming.
Housing Market: Sales Decrease While Prices Rise
Signs of declines in the housing market have been persistent and clear. Building permits and housing starts—leading indicators of new home supplies—continued to contract in June at monthly rates of 0.6 percent and 2 percent, respectively. On the demand side, buyers are hitting the brakes as June posted a monthly decline of 5.4 percent in existing home sales—a fifth consecutive decline this year. There is no doubt the housing market is feeling the impact of the Federal Reserve rate hikes, which have helped to push down demand.
However, it appears home sellers have not gotten the memo yet. While sales and construction have cooled down, prices have not as the median sales price of an existing home reached a record high of $416,000 in June. The housing market is witnessing a new dynamic where some buyers are rushing to buy at higher prices before further rate hikes increase unaffordability and others are completely priced out. Sellers, meanwhile, are refusing to give up.
This dynamic further pushes the negotiating power toward sellers—at least for now. It will likely take until the start of winter this year for the reality of high rates to be fully absorbed by both sides.
Median Existing-Home Sales Price Hits Record High (In Thousands of Dollars)
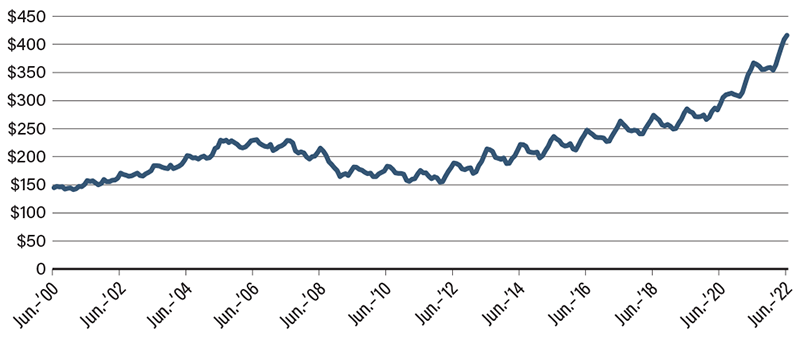
Source: Bloomberg
Recent Economic Releases
| Indicator | Prior period | Current period (forecast) | Current period (actual) |
|---|---|---|---|
| U.S. Industrial Production (June)(MoM) | 0.0% | 0.1% | -0.2% |
| Conference Board Leading Economic Index (June)(MoM) | -0.6% | -0.5% | -0.8% |
| Housing Starts (June)(MoM) | -11.9% | 0.7% | -2.0% |
| Existing-Home Sales (June)(MoM) | -3.4% | -0.6% | -5.4% |
