Eyes on the Economy: Purchasing, Economic Activity, Home Prices

Business Activity Slows But Still Expands
The S&P Global Composite Purchasing Managers’ Index (PMI) edged slightly down to 54.1 in August from 54.3 in July. Nonetheless, a reading above 50 indicates expansion. This marks the 19th consecutive month of expansion. The S&P Composite PMI covers about 70% of all industries and is divided into two broad categories: services and manufacturing.
Growth in the composite index was driven by services. The reading for S&P Services PMI was 55.2, slightly higher than July’s reading of 55. This points to somewhat stronger growth in the sector, which offset the deterioration in manufacturing. Services contracted for the second consecutive month after some recovery earlier this year. Coming out at 48, the S&P Manufacturing PMI fell below market expectations of 49.6, posting the largest contraction so far this year. Inflows of new work dropped at the sharpest pace since December 2023. Employment levels in manufacturing stalled while input costs accelerated the most since May.
National Economic Activity Index Declines
The Chicago Fed National Activity Index (CFNAI) declined to minus 0.34 in July after a minus 0.09 reading in June, falling below market expectations of 0.03. The larger drop in July was largely driven by production-related indicators. A small increase in personal consumption and housing was offset by decreases in other categories.
CFNAI is a gauge that captures overall economic activity and related inflationary pressure. It is based on a weighted average of 85 existing monthly indicators of national economic activity, with an average value of zero and a standard deviation of one. A positive reading corresponds to growth above trend and a negative reading represents growth below trend.
July Sees Another Month of Record-Breaking Home Prices
Home prices in the United States continued to break records in July as the S&P CoreLogic Case-Shiller National Home Price Index rose 0.5% month-over-month and 5.4% year-over-year. The index continued to show above-trend real prices after accounting for inflation. Although the growth rate of home prices has eased, it has remained higher than inflation. The National Home Price Index averages about 2.8% more than the Consumer Price Index. Without accounting for inflation, home prices have increased 1,100% since 1974. Adjusted for inflation, the figure is 111%.
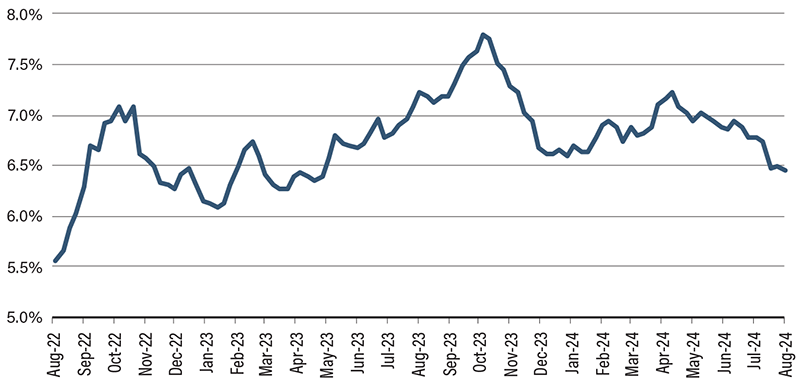
Although home prices have shown signs of relief, new-home sales increased 10.6% month-over-month in July as mortgage rates started falling. Pent-up demand has begun rushing back into the housing market as the Federal Reserve is set to begin cutting interest rates in September. With mortgage rates falling, rising demand will likely push home prices even higher. Although the declining mortgage rates and rising home prices may partially offset each other when it comes to a monthly mortgage payment, affordability issues will not be resolved as buyers will likely need bigger mortgages to pay for higher home prices.
30-Year Fixed Mortgage Rates

Source: Federal Reserve Economic Data, Federal Reserve Bank of St. Louis.
Recent Economic Releases
| Indicator | Prior period | Current period (forecast) | Current period (actual) |
|---|---|---|---|
| S&P Composite PMI (Aug.) | 54.3 | 53.5 | 54.1 |
| Chicago Fed National Activity Index (July) | (0.09) | 0.03 | (0.34) |
| S&P CoreLogic Case-Shiller National Home Price Index (June)(YoY) | 5.9% | N/A | 5.4% |
| New-Home Sales (July)(MoM) | (0.6%) | 1.0% | 10.6% |
