economy
July 24, 2023
Eyes on the Economy: Retail Sales, Industrial Production, Housing Market

Retail Sales Decelerate
U.S. retail sales increased 0.2% in June, well below market forecasts of 0.5%. The deceleration came after an upwardly revised growth of 0.5% in May. Of the 13 categories, seven posted increases. These include miscellaneous store retailers, nonstore retailers, furniture and appliances. Meanwhile, gas stations posted the biggest decline of all major categories as energy prices have been falling after surges last year. Other categories that posted declines include building materials and grocery stores.
Despite deceleration and falling below forecasts, observers remain cheerful as they see consumers continue to spend despite higher prices. Note that retail sales data are adjusted for seasonal factors but not price changes (i.e., inflation).
Industrial Production Declines in June
U.S. industrial production went down 0.4% in June, the first annual decline since February 2021. On a monthly basis, it decreased 0.5% following another 0.5% decrease in May. In both yearly and monthly measures, industrial production fell below market forecasts. However, the second quarter as a whole posted a growth rate of 0.7%.
Most major industries contributed to the June decline, with utilities posting the biggest drop of 2.6% from the previous month. Manufacturing moved down 0.3%. Although manufacturing posted growth in the whole second quarter thanks to a large jump in the production of motor vehicles and parts, the last month of the quarter saw a decline in this key driver category. Meanwhile, capacity utilization for manufacturing edged down to 78%, slightly below its long-run average.
Overall, we have not seen a sustained downtrend in industrial production yet. While there has been clear deceleration, June might have been the beginning of a decline.
Housing Market Index Continues To Improve
Although it was the first sector to decline after the Federal Reserve began raising interest rates, the housing market has been recovering. The National Association of Home Builders Housing Market Index edged up to 56 in July from 55 in June—the seventh consecutive month of increases since its recent low in December 2022. Home builders’ confidence also rose despite caution on high interest rates.
The impact of low inventory has so far outweighed that of rising interest rates. Although home prices have come down a bit, they are still roughly 41% higher than pre-pandemic price tags. Meanwhile, the latest data indicate the count of active home listings is far below pre-pandemic levels. Despite the fact that demand has been deterred by higher mortgage rates, supply shortages have kept home prices elevated.
Existing homeowners are unlikely to sell their homes bought with low mortgage rates if they expect to pay higher rates to purchase their next home. In fact, Redfin reported that only 1% of U.S. homes have changed hands so far this year. That is the lowest turnover rate in a decade. Thus, home prices are unlikely to crash.
Housing Market Continues To Recover
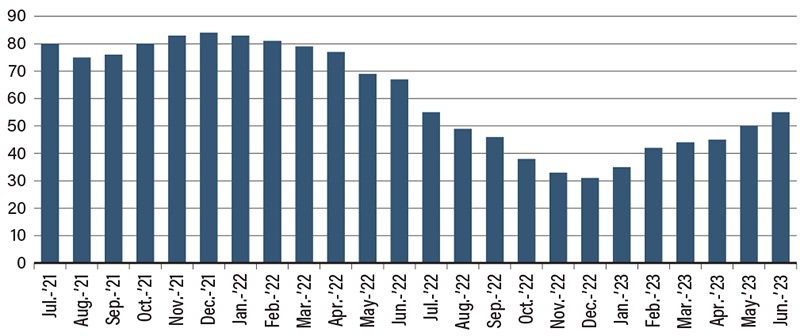
Source: Trading Economics.
Recent Economic Releases
| Indicator | Prior period | Current period (forecast) | Current period (actual) |
|---|---|---|---|
| Retail Sales (Jun.)(MoM) | 0.5% | 0.5% | 0.2% |
| Industrial Production (Jun.)(YoY) | 0.0% | 1.1% | (0.4%) |
| Capacity Utilization (Jun.) | 79.4% | 79.5% | 78.9% |
| NAHB Housing Market Index (Jun.) | 55 | 56 | 56 |
