Eyes on the Economy: Retail Sales, Leading Indicators, Homebuilder Confidence

May Retail Sales Were Weaker than Expected
U.S. retail sales edged up 0.1% in May from the downwardly revised month-over-month decline of 0.2% in April. May’s reading fell below market expectations of 0.2% monthly growth. Excluding motor vehicles and parts, retail sales dropped 0.1%. Retail sales excluding food services, auto dealers, building materials stores and gasoline stations—which are used to calculate Gross Domestic Product—increased 0.4%, following a 0.5% fall in April. On a year-over-year basis, retail sales rose 2.3%. Note that retail sales are reported in current dollars and therefore not adjusted for inflation.
Overall, retail sales data paint a mixed story. Since it’s not adjusted for inflation, a decline or slowdown may reflect either easing inflation or glooming consumer sentiment. A fall in sales at gas stations were driven by lower prices, whereas sales of food and drink services—dining out sales—are viewed as an indicator of household finances, and recent declines suggest a loss of momentum.
Leading Indicators Continue To Fall
The Conference Board Leading Economic Index (LEI), a composite of leading economic indicators, declined 0.5% in May. LEI has been falling since 2022, when the Federal Reserve started raising interest rates. Over the last six months, the index dropped 2%.
Leading indicators change before the overall economy; therefore, declines of leading indicators can signal an upcoming economic downturn. However, interpretation of such downturn movement must meet three criteria: duration, depth and diffusion. Duration is how long the indicators have declined. Depth refers to the size of the decline. And diffusion measures how widespread the decline is. A recession is impending when 1) six-month LEI change drops more than 4.4% and 2) the diffusion index is below 50. The criteria were met for many months over the past two years—but not in April and May.
Homebuilder Confidence Further Declines
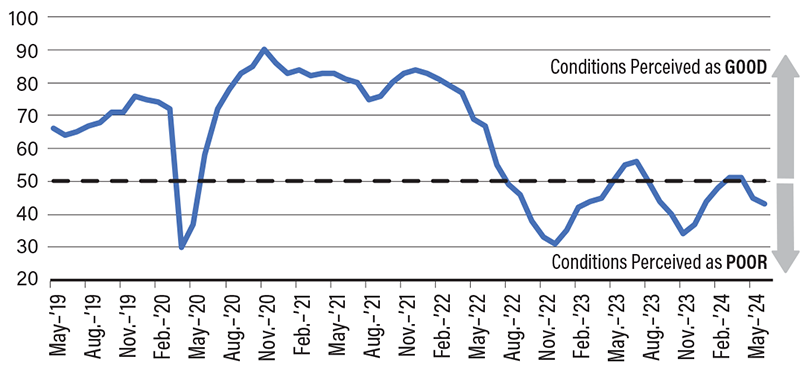
The National Association of Home Builders/Wells Fargo Housing Market Index slipped to 43 in June, a two-point drop from May, marking the lowest reading since December 2023. A reading below 50 indicates builders view market conditions as poor, whereas a reading above 50 suggests market conditions are perceived as good. The decline in builder confidence was primarily driven by elevated mortgage rates and construction financing costs.
Meanwhile, building permits fell 3.8% in May from the previous month, posting a third consecutive month of decline. Housing starts unexpectedly dropped 5.5% month-over-month in May to 1.27 million, the lowest level since July 2020. Building permits and housing starts are indicators for future new home supply. Declines in both suggest a gloomy outlook for a housing market already strained by low supply. The picture of the housing market gets worse, as existing home sales decreased 0.7% month-over-month to 4.11 million units in May. This came as median existing home sale prices reached $419,300, the highest on record. Buying a home has become increasingly unaffordable, as potential buyers struggle with high prices and elevated mortgage rates. Despite the fact that demand is still there, the current price level simply means a large fraction of demand will not be met.
Housing Market Index

Source: Trading Economics.
Recent Economic Releases
| Indicator | Prior period | Current period (forecast) | Current period (actual) |
|---|---|---|---|
| Retail Sales (May)(MoM) | (0.2%) | 0.2% | 0.1% |
| Leading Economic Index (May)(MoM) | (0.6%) | (0.3%) | (0.5%) |
| NAHB Housing Market Index (Jun) | 45 | 45 | 43 |
| Existing-Home Sales | 4.14M | 4.10M | 4.11M |
