economy
August 29, 2022
Eyes on the Economy: Retail Sales, Recession, Housing

Retail Sales Hold Steady
On a month-over-month basis, retail sales were unchanged in July, but increased 0.7 percent when excluding gasoline and auto sales. As gasoline prices began to fall, other goods received bigger shares of consumer spending. Note that July is a month of high activity, particularly related to summer vacation and back-to-school spending. It is unsurprising that purchases of goods such as electronics—a category tied to back-to-school spending—posted increases.
It is worth noting that sales figures are not adjusted for inflation. Consumers might have purchased the same or fewer units of goods at higher prices. The irony is the same observers who cheer and see increases in sales as consumer resiliency are those who are worried about further rate hikes, ignoring the fact rate hikes are intended to curb inflation by bringing down consumer spending, and the so-called consumer resiliency is the opposite of what is needed to stop rate hikes.
Leading Indicators Point to a Recession
The Conference Board Leading Economic Index (LEI) declined for a fifth consecutive month in July. The composite of 10 leading economic indicators dropped 0.4 percent from the previous month and 1.6 percent between January and July 2022. As the name suggests, leading economic indicators anticipate turning points in the business cycle. The LEI typically predicts a turning point in approximately seven months. The decline suggests a rising probability of a recession in the near term.
With worrying indicators—such as consumer pessimism, volatile equity market and declining housing construction and manufacturing new orders—economic weakness is expected to intensify and spread broadly throughout the economy. Accordingly, the Conference Board expects that real gross domestic product is not expanding in the current quarter. That is potentially a third quarter of negative growth. It projects a short and mild recession by the end of this year or early 2023.
Housing Market Continues To Decline
Interest rate hikes appear to be claiming their first victim: the housing market. On the supply side, housing starts and building permits decreased 9.6 percent and 1.3 percent, respectively, from a month ago. Both are indicators of new-home availability in the future. The declines suggest we are unlikely to see big increases in inventory despite buyers pulling back due to higher rates. Additionally, the National Association of Home Builders (NAHB) housing market index—which measures homebuilders’ expectations—declined for an eight consecutive month in August to the lowest reading since May 2020. NAHB notes that monetary tightening and persistently high construction costs have already brought what it refers to as a housing recession.
Existing-home sales decreased 5.9 percent to 4.81 million in July, marking the sixth consecutive month of declines and the lowest level since May 2020. Nonetheless, the median existing-home sales price increased 10.8 percent from a year ago to $403,800—a slight decline from June’s record high of $413,800. As previously discussed, home sale prices are stubbornly high and unlikely to crash as in 2008, although further moderate declines may be expected this winter.
Given the current conditions of supply and demand, the housing market is likely to see the normalizing of home prices, returning to the pre-pandemic trend from the unprecedented price levels seen during the last two years.
Median Homes Sales Price Remains High
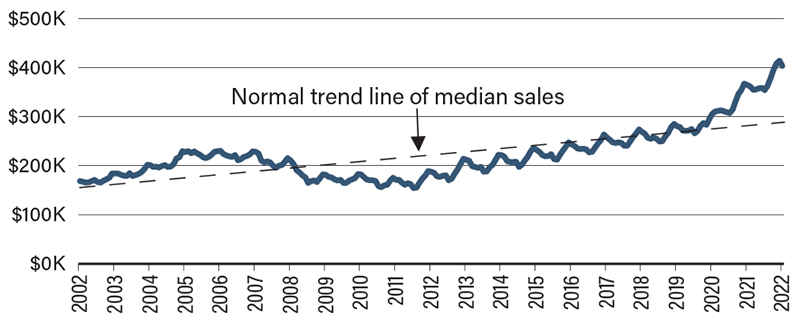
Source: Bloomberg
Recent Economic Releases
| Indicator | Prior period | Current period (forecast) | Current period (actual) |
|---|---|---|---|
| Retail Sales (Jul.)(MoM) | 0.8% | 0.1% | 0.0% |
| Conference Board Leading Economic Index (Jul.)(MoM) | -0.8% | -0.5% | -0.4% |
| Housing Starts (Jul.)(MoM) | 2.4% | -6.7% | -9.6% |
| Existing-Home Sales (Jul.)(MoM) | -5.5% | -4.5% | -5.9% |
