economy
January 31, 2022
Eyes on the Economy: Virus, Housing, Inflation

Virus Impact Still Weighs on Consumer Sentiment
U.S. consumer confidence dipped in January under the weight of increased COVID-19 infections, according to the preliminary report from the University of Michigan. Its sentiment index fell 1.8 points to 68.8 in January from 70.6 in December. The drop was led by expectations. The list of impediments to a stronger rebound remains long, including omicron, rising prices, and massive fiscal and monetary policy uncertainty. The stock market, another potential driver of the confidence measure, has been falling but remains within its range since late October, so the impact may be small. The outlook depends on a variety of factors including gasoline prices, infection rates, the stock market, broader inflation and events in Washington D.C.
Housing Market Remains Solid Despite Higher Rates
Homebuilder confidence edged down 1 point to 83 in January. The index has remained above 80 since October. Supply-chain issues and rising costs pushed builder sentiment down this month. Even so, the housing market’s limited inventories and strong demand ensure building conditions remain in good shape. The index is well above the 50-point threshold indicating positive building conditions during the next six months. Additionally, demographic trends are favorable with the bulk of millennials hitting prime home-buying age. Demand remains strong despite declining affordability due to rising costs. The short-term outlook remains positive and housing permits are forecast to rise in the coming quarters. However, the market is not without challenges. The overall cost of residential construction materials has increased nearly 19 percent over the past year, according to the National Association of Home Builders. Poor material availability is increasing builder costs and timelines. Meanwhile, there is also a lack of open lots near high-demand areas.
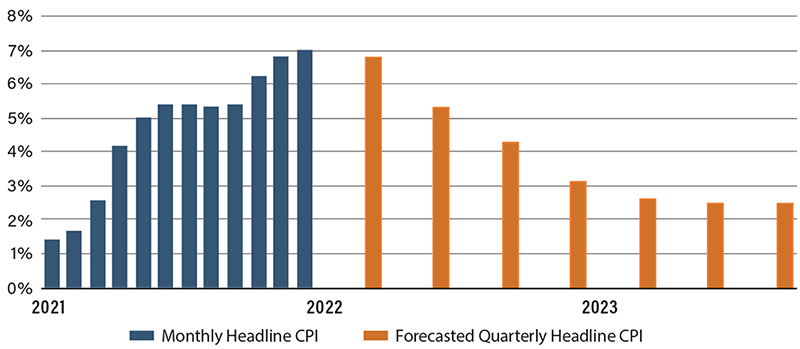
Autos Drive CPI to Highest Rate in 40 Years
The December Consumer Price Index showed strong demand and supply bottlenecks still at play, with goods inflation driven higher by auto and apparel prices. Details showed the drag to be from energy and some moderation in food-price inflation. Looking at the core, which strips out food and energy components, vehicles played a large role yet again, with robust price increases for both new and used autos. Supply bottlenecks and a dearth of year-end sales were main hiccups.
The recent release will keep the Federal Reserve focused on the upside risks to its preferred inflation target of 2 percent and enhance the need to start winding down monetary policy accommodation in short order. In December the Fed signaled that it’s likely to raise interest rates by three-quarters of a percentage point this year and also begin trimming its $8.9 trillion balance sheet. The majority of economists believe inflation will begin to slow with improvements in supply-chain bottlenecks and the imbalance between durable goods and services. Others, however, fear that the gravity of the situation is still understated with bottlenecks in China, rising oil costs, more expensive housing, tightening labor markets and low borrowing costs all pointing to continued price pressures.
Forecasted Inflation Expected to Slow
Recent Economic Releases
| Indicator | Prior period | Current period (forecast) | Current period (actual) |
|---|---|---|---|
| Consumer Price Index (Dec.) (YoY) | 6.8% | 7.0% | 7.0% |
| University of Michigan Sentiment (Jan.) | 70.6 | 70.0 | 68.8 |
| NAHB Housing Market Index (Jan.) | 84.0 | 84.0 | 83.0 |