economy
July 27, 2026
Eyes on the Economy: Builder Confidence, Industrial Output

Homebuilder Confidence Slips Further as Affordability Pressures Persist
Builder confidence in the U.S. single-family housing market weakened in July, with the National Association of Home Builders (NAHB) Housing Market Index falling from 36 to 34 in June. The index has remained below 40 for 15 consecutive months, reflecting continued weakness in the housing sector. Builders cited elevated mortgage rates, rising material and land costs, skilled labor shortages and broader economic uncertainty as key factors keeping many prospective buyers on the sidelines. Despite the recent passage of the 21st Century ROAD to Housing Act—which includes measures aimed at easing zoning restrictions, improving financing and expanding housing supply—industry leaders expect its benefits to take time to materialize. Soft demand continues to pressure builders, with 37% cutting home prices in July, up from 35% in June, while the average price reduction held at 6%. Sales incentives remained widespread, used by 63% of builders. All major components of the index declined, including current sales, future sales expectations and prospective buyer traffic, underscoring ongoing affordability challenges in the housing market.
Industrial Output Rises in June
U.S. industrial production edged up 0.1% in June, contributing to a solid 4.0% annualized gain in the second quarter. Manufacturing output was unchanged for the month but increased at a 4.7% annualized pace during the quarter—while mining and utilities each rose 0.4% in June. Consumer goods production increased 0.3%, supported by gains in both durable and nondurable goods, though business equipment output fell 0.4% due to weaker information processing and industrial equipment production. Within manufacturing, declines in several durable goods industries were offset by a 2.1% jump in petroleum and coal products. Mining remained a bright spot, expanding 7.5% in the second quarter. Manufacturing capacity utilization slipped to 75.7%, remaining well below its long-run average, while mining utilization rose above its historical norm, reflecting continued strength in the sector.
June’s Inflation Eases After Iran Ceasefire
The Consumer Price Index eased to 3.5% in June 2026, marking its first annual deceleration in five months and coming in below expectations of 3.8%. The improvement was driven largely by lower energy prices following the U.S.-Iran ceasefire, which reduced pressure on global energy markets. Annual energy inflation slowed to 15.7% from 23.5% in May, with gasoline prices rising 26.7% and fuel oil 42.9%, both at a slower pace than the previous month. Inflation also moderated slightly for shelter (3.3%) and food (3.0%). On a monthly basis, consumer prices fell 0.4%, the largest decline since April 2020, as a 5.7% drop in energy prices more than offset modest increases in shelter and food. Core inflation, which excludes food and energy, slowed to 2.6% from 2.9%, reflecting easing price pressures across categories such as shelter, apparel, medical care and household furnishings. Monthly core prices were unchanged, underscoring a broader moderation in underlying inflation.
On the wholesale side, the Producer Price Index increased 5.5% year over year in June 2026, the lowest reading in three months, following a downwardly revised 6% gain in May and below forecasts of 6.2%. Given that June’s price deceleration was driven largely by the ceasefire, which has since been broken, volatility in inflation reporting is to be expected.
Energy Inflation Eased in June
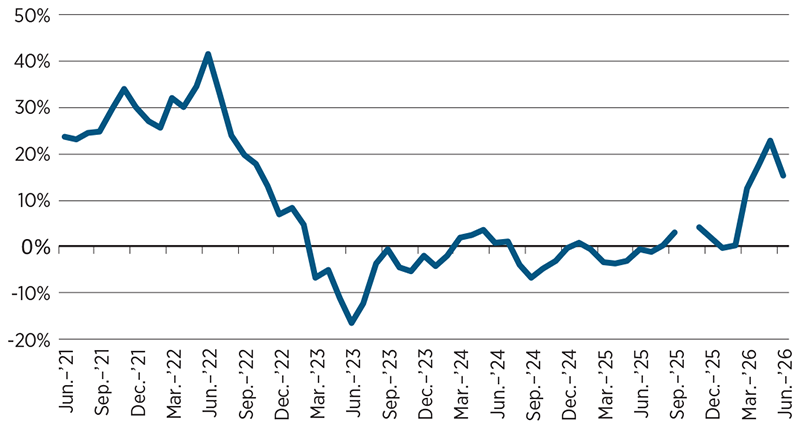
Sources: Federal Reserve Bank of St. Louis.
Recent Economic Releases
| Indicator | Prior period | Current period (forecast) | Current period (actual) |
|---|---|---|---|
| NAHB Housing Market Index (Jun.) | 36 | 35 | 34 |
| Industrial Production (Jun.)(MoM) | 0.1% | 0.2% | 0.1% |
| Consumer Price Index (Jun.)(YoY) | 4.2% | 3.8% | 3.5% |
| Producer Price Index (Jun.)(YoY) | 6.0% | 6.2% | 5.5% |
Key Interest Rates
| 7/20/26 | 7/13/26 | Change | |
|---|---|---|---|
| Fed Funds | 3.75% | 3.75% | --- |
| 2-yr. UST | 4.22% | 4.26% | (0.04) |
| 5-yr. UST | 4.33% | 4.36% | (0.03) |
| 10-yr. UST | 4.60% | 4.61% | (0.01) |
| 30-yr. UST | 5.12% | 5.10% | 0.02 |
Rate Forecast — Futures Market
| 3Q26 | 4Q26 | 1Q27 | 2Q27 | |
|---|---|---|---|---|
| 4.00% | 4.25% | 4.25% | 4.25% | |
| 3.98% | 3.89% | 3.80% | 3.74% | |
| 4.08% | 4.02% | 3.97% | 3.94% | |
| 4.44% | 4.39% | 4.35% | 4.33% | |
| 4.94% | 4.90% | 4.87% | 4.86% |