economy
June 22, 2026
Eyes on the Economy: Confidence, Production, Inflation

Small Business Confidence Slips as Hiring and Investment Plans Cool
The latest National Federation of Independent Business survey paints a picture of a small-business sector that is becoming more cautious despite pockets of optimism around artificial intelligence-driven investment. The Small Business Optimism Index slipped to 95.3, remaining below its long-term average, while uncertainty rose sharply and remains historically elevated. Hiring conditions have softened considerably: Unfilled job openings fell to their lowest level since May 2020, hiring plans dropped to a six-year low and concerns about labor quality declined as labor shortages eased. However, labor cost was a top business concern.
The survey also points to slowing business investment, with planned capital expenditures falling to their lowest level since 2009. At the same time, inflation pressures appear to be reaccelerating. More firms reported supply-chain disruptions, inflation rose as a concern and both actual and planned price increases jumped to their highest levels in years. Overall, small businesses appear less constrained by labor shortages but increasingly pressured by rising costs, supply disruptions and uncertainty, creating a challenging environment for growth and hiring.
Industrial Production Expands Modestly
U.S. industrial production rose a modest 0.1% in May following a strong 0.9% gain in April. Manufacturing output was unchanged overall, as a 0.8% increase in durable goods production was offset by a 0.9% decline in nondurable goods. Durable manufacturing was broadly strong, with notable gains in motor vehicles, primary metals, wood products and nonmetallic minerals. Mining output increased 1.3%, providing the largest boost to overall production, while utilities output fell 0.4%.
Demand was mixed across end markets. Production of business equipment, defense and space equipment, and construction supplies increased, while consumer goods output declined, driven by weakness in nondurable consumer products. Total industrial production was 1.7% above its level a year earlier. Capacity utilization edged up to 76.2%, remaining well below its long-term average, suggesting ample spare capacity despite ongoing industrial expansion.
Consumer and Wholesale Inflation Reaccelerates
U.S. inflation accelerated further in May 2026, with the Consumer Price Index rising 4.2% year over year, up from 3.8% in April and reaching its highest level since April 2023. The increase marks the third consecutive month of rising inflation and was driven primarily by a sharp surge in energy prices due to the conflict with Iran. Energy costs climbed 23.5% from a year earlier, with gasoline prices soaring 40.5% and fuel oil prices rising 58.9%. Energy also accounted for more than 60% of the monthly increase in consumer prices. Meanwhile, shelter inflation edged up to 3.4% while food inflation accelerated to 3.1%. Core inflation, which excludes food and energy, increased to 2.9% annually, its highest level since September 2025.
Upstream inflation also intensified. The Producer Price Index rose 6.5% year over year, the fastest pace since late 2022 and the fourth consecutive monthly acceleration. However, core producer inflation remained more stable at 4.9%, the highest since January 2023. Although the recent resurgence of both consumer and wholesale inflation is largely driven by oil prices, underlying inflation continues to be persistent and well above the target rate.
Consumer, Wholesale Inflation Reaccelerates
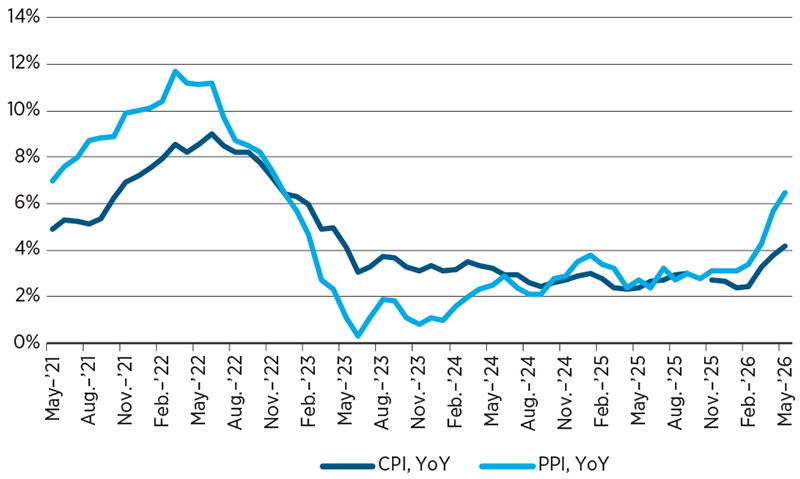
Source: Trading Economics.
Recent Economic Releases
| Indicator | Prior period | Current period (forecast) | Current period (actual) |
|---|---|---|---|
| NFIB Small Business Optimism (May) | 95.9 | 96.0 | 95.3 |
| Industrial Production (May)(MoM) | 0.9% | 0.3% | 0.1% |
| Consumer Price Index (May)(YoY) | 3.8% | 4.2% | 4.2% |
| Producer Price Index (May)(YoY) | 5.7% | 6.4% | 6.5% |
Key Interest Rates
| 6/15/26 | 6/8/26 | Change | |
|---|---|---|---|
| Fed Funds | 3.75% | 3.75% | --- |
| 2-yr. UST | 4.06% | 4.16% | (0.10) |
| 5-yr. UST | 4.19% | 4.28% | (0.09) |
| 10-yr. UST | 4.47% | 4.55% | (0.08) |
| 30-yr. UST | 4.97% | 5.02% | (0.05) |
Rate Forecast — Futures Market
| 3Q26 | 4Q26 | 1Q27 | 2Q27 | |
|---|---|---|---|---|
| 4.00% | 4.00% | 4.25% | 4.25% | |
| 3.77% | 3.71% | 3.66% | 3.63% | |
| 3.97% | 3.92% | 3.88% | 3.86% | |
| 4.36% | 4.31% | 4.27% | 4.27% | |
| 4.93% | 4.89% | 4.85% | 4.83% |
