economy
February 17, 2026
Eyes on the Economy: Retail Stalls, Job Cuts Surge, Delinquencies Rise

Retail Sales Stall in December
U.S. retail sales unexpectedly stalled in December, posting no gain from the previous month and signaling that consumer momentum faded at the end of the year. After a solid 0.6% month-over-month gain in November, overall retail purchases were flat, according to Commerce Department data. Sales excluding autos and gasoline were also unchanged, with eight of 13 retail categories posting declines, including clothing, furniture and auto dealers. Gains at building materials and sporting goods stores offered limited offsets.
The data suggest that the early holiday shopping surge was short-lived, as households remain strained by high living costs and concerns about the job market. Spending strength appears uneven, with wealthier consumers supported by stock-market gains while lower-income households show softer discretionary spending. Severe winter weather further clouded the outlook, disrupting activity and complicating assessment of underlying demand. Economists expect consumer spending growth to slow in the first quarter of 2026.
Job Cuts Surge to Highest January Level Since 2009
U.S. employers announced 108,435 job cuts in January, more than double from a year earlier and up 205% from December, according to a report by Challenger, Gray & Christmas. It was the highest January total since 2009 and the largest monthly figure since October 2025, signaling weak employer confidence heading into 2026.
Transportation led layoffs with 31,243 cuts, largely due to UPS eliminating 30,000 jobs after ending its relationship with Amazon. Technology followed with 22,291 cuts, including 16,000 at Amazon tied mainly to restructuring. Healthcare announced 17,107 cuts amid inflation, high labor costs and lower government reimbursements. Chemical manufacturers cut 4,701 jobs, while media layoffs declined.
Contract losses, market conditions and restructuring were the top reasons for layoffs. Artificial intelligence was cited in 7% of cuts, though its overall impact remains unclear. Meanwhile, hiring plans fell sharply to 5,306—the lowest January level on record.
Delinquencies Rise with Strain Concentrated in Lower-Income Areas
Total U.S. household debt increased $191 billion (1.0%) in the fourth quarter of 2025 to $18.8 trillion, according to the Federal Reserve Bank of New York’s Quarterly Report on Household Debt and Credit. The increase was broad-based across major loan categories.
Delinquency rates jumped to 4.8%, the highest since 2017. Early-stage delinquencies rose for mortgages and student loans, while serious delinquencies increased for credit cards, mortgages and student loans. The student loan delinquency rate remains elevated at 9.6%, reflecting the resumption of payment reporting after pandemic forbearance, with about 1 million severely delinquent borrowers transferred to the Department of Education’s Default Resolution Group.
Although overall mortgage delinquency rates remain low by historical standards, they have been rising steadily in recent years, with significant variation across income levels and local economic conditions. Since 2021, 90+ day delinquency rates in the lowest-income areas have surged from about 0.5% to nearly 3.0% by late 2025, while the highest-income areas remain comparatively stable. Middle-income areas have shown moderate increases. Rising unemployment and declining home prices are strongly correlated with higher mortgage delinquencies, according to a study from New York Fed researchers.
Mortgage Delinquency Rates Rise to Levels of 10 Years Ago
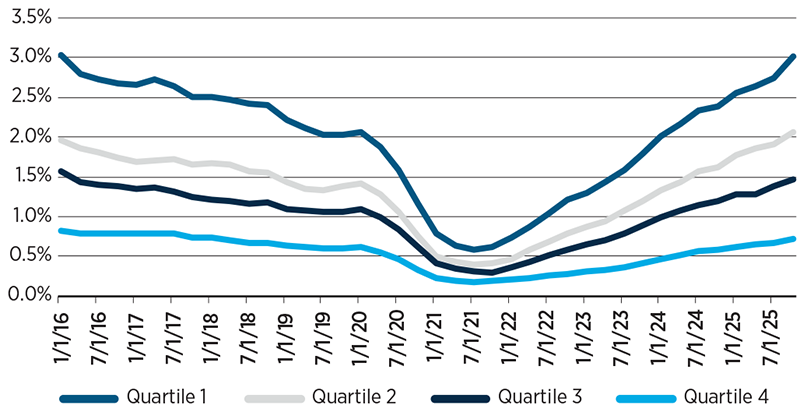
Sources: New York Fed Consumer Credit Panel/Equifax; IRS Statistics of Income.
Notes: The chart plots new 90+ days delinquent mortgage balances by zip-income quartile. The lowest-income quartile is quartile 1; the highest-income quartile is quartile 4. Mortgage delinquency rates are at an annual rate, summing over the four quarters.
Recent Economic Releases
| Indicator | Prior period | Current period (forecast) | Current period (actual) |
|---|---|---|---|
| Retail Sales (Dec.)(MoM) | 0.6% | 0.4% | 0.0% |
| Challenger Job Cuts (Jan.) | 35.6K | 43.0K | 108.4K |
| Total Household Debt (Q4 2025) | $18.6T | N/A | $18.8T |
| Delinquency Rate (Q4 2025) | 4.5% | N/A | 4.8% |
