economy
September 8, 2026
Eyes on the Economy: Inflation, Construction, Manufacturing

Fed’s Preferred Inflation Gauge Runs Hotter Than Expected
The Federal Reserve’s preferred inflation gauge ran slightly above expectations in July. The Personal Consumption Expenditures (PCE) Price Index rose 0.2% from June and 3.7% from a year earlier. Both readings exceeded consensus forecasts by 0.1 percentage points. Core PCE, which excludes volatile food and energy prices and is generally viewed as a better indicator of underlying inflation trends, increased 0.2% monthly and 3.3% annually, matching expectations.
In the same report, personal income rose 0.4% and consumer spending increased 0.2%, with both figures coming in above forecasts. Goods prices declined 0.1%, driven by a 2.7% drop in gasoline and other energy goods and a 0.9% decline in furnishings and durable household equipment. Services prices rose 0.3%, led by a 1.2% increase in financial services and insurance and a 0.3% rise in housing costs, underscoring persistent price pressures.
Construction Spending Falls as Residential Building Weakens Further
Construction spending in July declined 0.5% from the previous month to a seasonally adjusted annual rate of $2.158 trillion, falling short of the expected no change. June’s reading was revised upward to show flat spending. The July weakness was concentrated in housing, where spending dropped 1.3%, while nonresidential construction edged up 0.1%. Within nonresidential construction, spending fell sharply for conservation and development, down 1.4%, followed by manufacturing and public safety, both down 1%. A 2.9% increase in office construction partially offset those declines. Private construction spending decreased 0.5%, weighed down by a 3.2% decline in new single-family residential projects. Public construction spending also weakened, slipping 0.2% during the month. Through the first seven months of 2026, total construction spending reached $1.245 trillion, representing a 3.5% decline from the same period in 2025, underscoring persistent weakness across the construction sector as elevated borrowing costs continued to restrain housing activity and investment demand.
Manufacturing Expands, but Momentum Slows
U.S. manufacturing remained in expansion in August, though momentum slipped. The Institute for Supply Management (ISM) Manufacturing Purchasing Managers’ Index (PMI) fell to 54.6 from 55.6 in July. A reading above 50 indicates expansion while anything below 50 points to contraction.
New orders increased for an eighth consecutive month but slowed, while production expanded for the tenth straight month at a slightly weaker pace. Backlogs and imports also lost ground. Employment remained above the expansion threshold but declined, suggesting slower hiring. Supplier deliveries slowed further, inventories grew modestly and customer inventories remained unusually low, a potentially positive signal for future production. Input conditions remained challenging: The subindex for prices held at an elevated 71.1, reflecting persistent cost pressures. Manufacturer sentiment leaned negative, with respondents frequently citing price volatility, longer lead times, the Iran war and tariffs. One fifth of the manufacturing industry reported growth, although the share of manufacturing gross domestic product (GDP) in contraction rose slightly from July to August, indicating uneven conditions across industries.
In a separate report, the S&P Manufacturing PMI came out at 53.9 in August, affirming modest expansion in the sector. Telling a similar story, the S&P Manufacturing PMI also reported expansion but sliding momentum in both output and new orders.
Manufacturing in Expansion in 2026
Following Years of Contraction
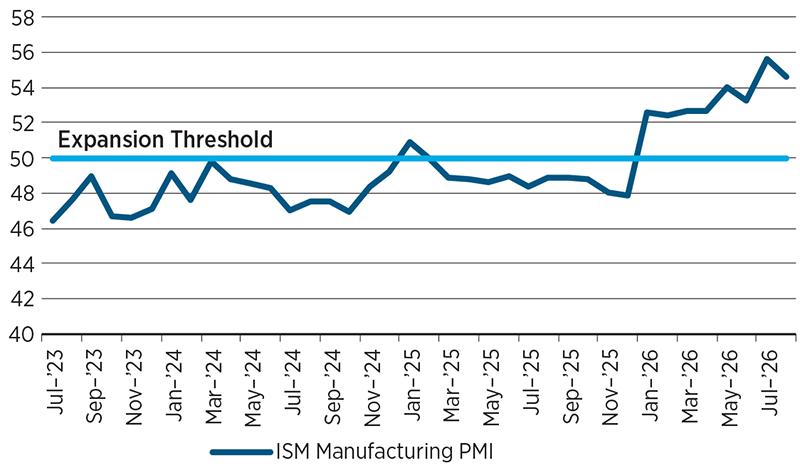
Source: Trading Economics.
Recent Economic Releases
| Indicator | Prior period | Current period (forecast) | Current period (actual) |
|---|---|---|---|
| Personal Consumption Expenditure Index (Jul)(YoY) | 3.7% | 3.6% | 3.7% |
| Construction Spending (Jul)(MoM) | 0.0% | 0.0% | (0.5%) |
| ISM Manufacturing PMI (Aug) | 55.6 | 55.2 | 54.6 |
| S&P Manufacturing PMI (Aug) | 53.9 | 53.2 | 53.9 |
Key Interest Rates
| 8/31/26 | 8/24/26 | Change | |
|---|---|---|---|
| Fed Funds | 3.75% | 3.75% | --- |
| 2-yr. UST | 4.35% | 4.24% | 0.11 |
| 5-yr. UST | 4.51% | 4.41% | 0.10 |
| 10-yr. UST | 4.76% | 4.70% | 0.06 |
| 30-yr. UST | 5.25% | 5.23% | 0.02 |
Rate Forecast — Futures Market
| 3Q26 | 4Q26 | 1Q27 | 2Q27 | |
|---|---|---|---|---|
| 4.00% | 4.25% | 4.25% | 4.25% | |
| 4.08% | 3.97% | 3.89% | 3.82% | |
| 4.17% | 4.09% | 4.00% | 3.96% | |
| 4.48% | 4.42% | 4.35% | 4.33% | |
| 4.96% | 4.91% | 4.87% | 4.86% |