economy
August 10, 2026
Eyes on the Economy: Consumer Confidence, Home Prices, GDP

Consumer Confidence Slips in July
The Conference Board Consumer Confidence Index fell 1.4 points to 90.8 in July, continuing its gradual decline since late 2021. The subindex for present situation dropped to 114.9, marking a third consecutive monthly decline, reflecting weaker assessments of current business conditions and a softer labor market. The share of consumers viewing business conditions positively narrowed to just above neutral, while fewer respondents said jobs were plentiful. Meanwhile, the subindex for expectations held steady at 74.7, remaining below the threshold typically associated with recession risk. Consumers continued to expect little improvement in business conditions over the next six months, although labor market expectations improved modestly and household income expectations remained positive despite softening. Confidence remained strongest among consumers under 35, Gen Z, Millennials and higher-income households. By political affiliation, confidence declined among Independents and Democrats, while Republicans became somewhat more optimistic.
Home Prices Continue to Post Annual Gains
The S&P Cotality Case-Shiller U.S. National Home Price Index rose 1.1% year over year in May, modestly higher than April’s 0.8% gain but well below the 2.4% annual increase recorded a year earlier. Price performance remained highly uneven across regions, with Chicago (6.9%), New York (4.2%) and Cleveland (3.1%) leading gains, while declines were posted in Las Vegas (1.9%), Seattle (1.8%), Denver (1.8%) and Tampa (1.6%). On a monthly basis, national home prices increased 0.6% from April, supported by the spring buying season, but prices slipped 0.05% after seasonal adjustment, highlighting underlying market weakness. Elevated mortgage rates around 6.5% and persistent inflation continue to weigh on affordability, limiting housing demand and discouraging buyers.
In a separate report, prices of single-family homes with mortgages guaranteed by Fannie Mae and Freddie Mac rose 2.2% year on year in May, following a 2% increase in April. The report recorded similar uneven regional home price performance, with the Pacific division posting a 0.3% decline while the Middle Atlantic division recorded the strongest gain at 4.5%.
Real GDP Moderates in Q2
Real gross domestic product (GDP) expanded at an annualized rate of 1.5% in the second quarter of 2026, according to the Bureau of Economic Analysis’ advance estimate, slowing from 2.1% growth in the first quarter. Economic growth was supported by increases in consumer spending, business investment and exports, though these gains were partially offset by a decline in government spending. Imports also rose during the quarter, subtracting from overall GDP growth as they are counted as a negative in the national accounts.
Compared with the first quarter, the slowdown in GDP reflected weaker contributions from several major components. Government spending declined after contributing positively earlier in the year, while both gross investment and export growth moderated. At the same time, consumer spending accelerated, providing the strongest source of support for overall economic activity. Faster import growth also weighed more heavily on headline GDP.
Although gross investment moderated, the nonresidential investment component remained strong, posting a growth rate of 8.8%. It is difficult to separate the driving factors of nonresidential investment. The direct artificial intelligence (AI)-related categories continued to dominate, while other categories like industrial and transportation equipment, which may indirectly link to AI, also expanded.
Contributions to GDP Growth
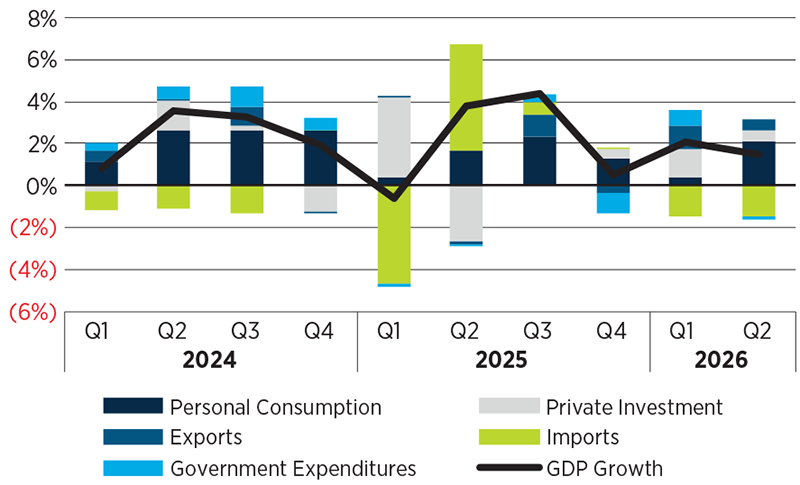
Source: Bureau of Labor Statistics.
Recent Economic Releases
| Indicator | Prior period | Current period (forecast) | Current period (actual) |
|---|---|---|---|
| Conference Board Consumer Confidence (Jul.) | 92.2 | 92.0 | 90.8 |
| S&P Case-Shiller Home Price Index (May)(YoY) | 0.8% | N/A | 1.1% |
| House Price Index (May)(YoY) | 2.0% | N/A | 2.2% |
| Real GDP Growth (Q2 2026)(QoQ) | 2.1% | 2.1% | 1.5% |
Key Interest Rates
| 8/3/26 | 7/27/26 | Change | |
|---|---|---|---|
| Fed Funds | 3.75% | 3.75% | --- |
| 2-yr. UST | 4.26% | 4.32% | (0.06) |
| 5-yr. UST | 4.40% | 4.40% | --- |
| 10-yr. UST | 4.68% | 4.64% | 0.04 |
| 30-yr. UST | 5.23% | 5.13% | 0.10 |
Rate Forecast — Futures Market
| 3Q26 | 4Q26 | 1Q27 | 2Q27 | |
|---|---|---|---|---|
| 4.00% | 4.00% | 4.00% | 4.25% | |
| 4.08% | 3.97% | 3.89% | 3.82% | |
| 4.17% | 4.09% | 4.00% | 3.96% | |
| 4.48% | 4.42% | 4.35% | 4.33% | |
| 4.96% | 4.91% | 4.87% | 4.86% |